Threat Details Page
The Threat Details page provides details on the selected threat. View the details for a threat by selecting the threat from the list on the Threats Page and clicking View Details.
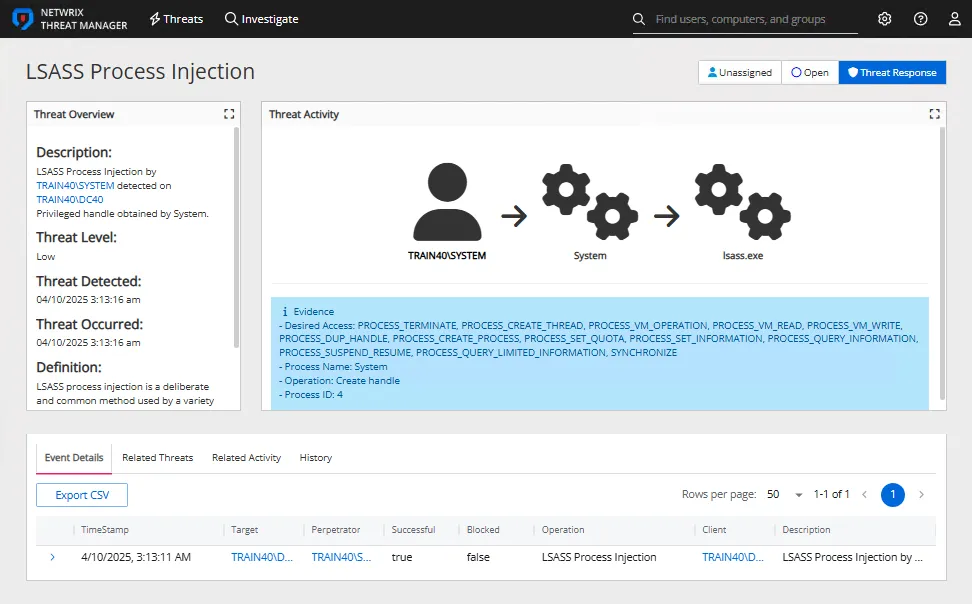
The top of the page displays a Threat Overview box, Threat Activity diagram, and an Evidence box.
The Threat Overview box that contains the following information:
- Description – Displays the threat type, the user account that generated the threat, a description of the threat activity and the host against which the threat occurred
- Threat Level – The relative severity level, or risk level, of the threat
- Threat Detected – The date and timestamp for the threat
- Definition – The threat definition is a detailed explanation of the threat providing insight into why the incident is a potential risk
The Threat Activity diagram contains a diagram that displays the flow of the threat activity.
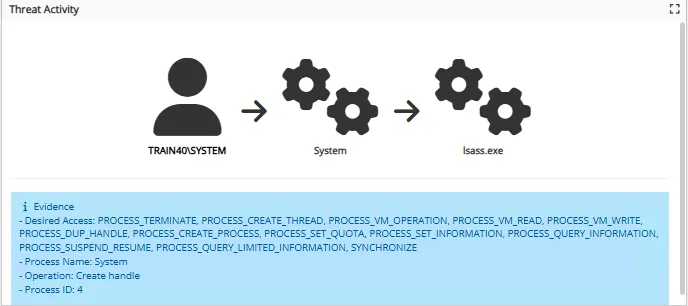
The Evidence box below the Threat Activity diagram provides specific information about the threat.
The Threats page displays three buttons in the top right corner:

- Unassigned – If the threat has not been assigned to an owner, the button displays as Unassigned. If a user has been assigned to an owner, the button displays the username. Click it to open the Workflow Window where assigned user and/or status can be updated.
- Set Status – If no status is set for the threat the button displays as Set Status. If a status has been set for the threat then this button displays the status of the threat. Click it to open the Workflow Window, where assigned user and/or status can be updated.
- Threat Response – Click to open the Threat Response Window and designate the playbook to response to the threat.
Workflow Window
The Workflow window displays the owner of a threat, or provides settings to assign an owner to a threat.

The Workflow window contains the following configuration settings:
The information displayed on this page is dependent upon the type of threat selected.
-
(Optional) Assigned To – Displays the user assigned to the threat. Assign or edit the Assigned User using the dropdown list. The list populates with users granted access to the console on the User Access page of the System Settings interface. See the User Access Page topic for additional information.
-
Set Status – Select a status for the threat from the dropdown list:
-
Open – Default status for new threats
-
Under Investigation – Threats that are under or pending investigation by an administrator
-
Closed - Resolved – Legitimate threats that have been contained or dealt with
-
Closed - False Positive – Behavior that has been incorrectly identified by Threat Manager as a threat
noteFalse positives influence abnormal behavior threat detection. Marking abnormal behavior threats as False Positive reduces the sensitivity of abnormality detection for this perpetrator.
-
-
(Optional) Comment – Add a comment to the threat
-
Ignore future threats of this type by (user) – Select this checkbox to ignore threats of this type from the selected user
-
Submit – Click to update the workflow
In the Threat Activity Diagram, click the user to view the User Details Page page. Click the host to view the Host Details Page page.
Threat Response Window
The Threat Response window contains the following configuration options:

- Select Playbook – Select a playbook for the threat response
- Description – Description of the playbook that has been selected
- Status – The state of the playbook
- Last Executed – When the playbook was last executed
The Threat Details Overview contains the following tabs:
- Event Details Tab
- Related Threats Tab
- Related Activity Tab
- History Tab
Event Details Tab
The Event Details tab shows details for the selected threat.

- Time Stamp – The exact date and time when the event occurred
- Target – The specific object, resource, or entity that was the focus of the event
- Perpetrator – The user or service account that initiated the event
- Successful – Indicates whether the action associated with the event was successfully completed True if the operation was successful. False if the operation failed
- Blocked – Indicates whether the operation was prevented by a security measure, such as a Netwrix agent True if the operation was blocked by a Netwrix agent. False if not blocked.
- Operation – Type of operation performed
- Client – The device, IP address, or host that initiated the event
- Description – A summary of the event
Use the Search icon to search for data in the table. Click the + icon in the table to view additional details about a threat. Click the Export CSV button to export the current rows displayed on the page into a CSV file. Click the Export All button to export all data returned into a CSV file.
Related Threats Tab
The Related Threats tab lists other threats generated by the same user that may be related to the threat listed in the Event Details tab.
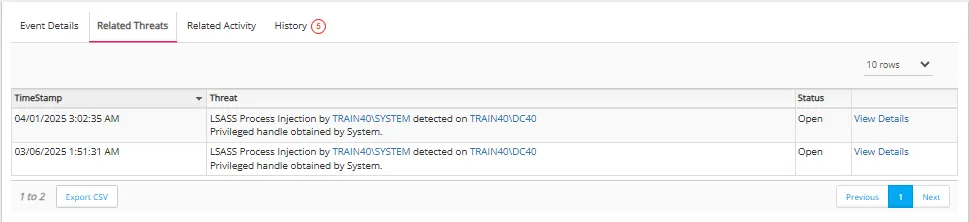
The Related Threats table has the following columns:
- Time Stamp – Time that the threat was detected
- Threat – Type of threat detected
- Status – Workflow status of the threat: Open, Under investigation, Closed - Resolved, or Closed - False Positive
- View Details – Click View Details to view the details page for the related threat
Use the Search icon to search for data in the table.
Related Activity Tab
The Related Activity tab lists activity by the selected user that may be related to the threat.
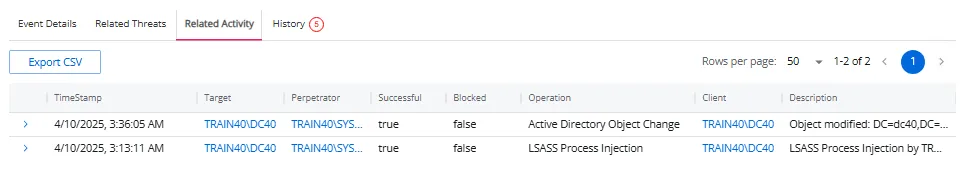
- Time Stamp – The exact date and time when the event occurred
- Target – The specific object, resource, or entity that was the focus of the event
- Perpetrator – The user or service account that initiated the event
- Successful – Indicates whether the action associated with the event was successfully completed True if the operation was successful. False if the operation failed
- Blocked – Indicates whether the operation was prevented by a security measure, such as a Netwrix agent True if the operation was blocked by a Netwrix agent. False if not blocked.
- Operation – The type of activity performed
- Client – The device, IP address, or host that initiated the event
- Description – A summary of the event
Use the Search icon to search for data in the table. Click the + icon in the table to view additional details about a threat. Click the Export CSV button to export the current rows displayed on the page into a CSV file. Click the Export All button to export all data returned into a CSV file.
History Tab
The History tab lists updates made to the threat in the Update box and provides a section to add comments.
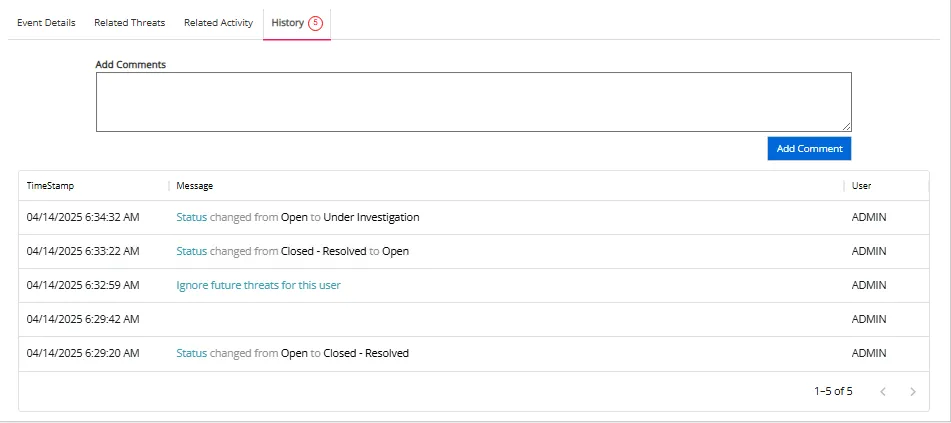
The History table has the following columns:
- Add Comments – Type any desired comments in the box and click Add Comment
- Time Stamp – Exact date and time when the status was updated.
- Message – Displays the content of the comments entered by users or the system
- User – The name of the user who entered the comment