Filters Section
The Filters section provides options to build a filter statement by selecting the Attribute, Operator, and Filter value. A time period for the report data is also configured here. If multiple data sources have been configured, there is also a Source dropdown menu. Filter statements can be simple with one value statement or complex with multiple value statements.

The section has the following options for configuring a filter statement:
- Source – This menu provides a list of all integrations with the application. If there is only one data source configured, the Source menudisplays that only. See the Netwrix Integrations Page topic for additional information.
- Timeframe – This menu provides several timeframe options as well as a clock and a calendar for setting a custom range. You must set the timeframe for the data to be returned in the report. If your report is blank, it is likely due to the timeframe setting. See the Timeframe topic for additional information.
- Attribute – This menu provides a list of attributes that are available on events in the data source. See the Filter Attribute Menu topic for additional information.
- Operator – This menu controls how the rule is evaluated by specifying the comparison between the Attribute and the Filter value. Options vary based on the selected attribute. See the Filter Operator Menu topic for additional information.
- Filter – Use it to specify the value to evaluate using the operator for the selected attribute
- Add – This appears in a new row of the Filter table, in the Attribute column. Clicking it opens the Attribute menu to add another filter statement.
- Clear All – This icon removes the respective filter statement
See the Build a Filter Statement topic for additional information.
Timeframe
You must set a timeframe for an investigation query. When you run a query, the application scans the available data for activity events that match the set filters for the specified timeframe. By default, the timeframe is set for the "Last Hour" of activity.
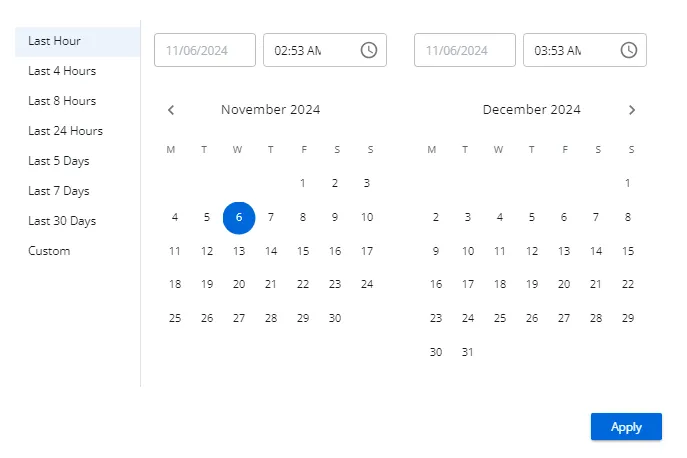
Click the displayed timeframeto open a window, which provides several timeframe options as well as a clock and a calendar for setting a custom range:
-
Preset timeframes:
- Last Hour
- Last 4 Hours
- Last 8 Hours
- Last 24 Hours
- Last 5 Days
- Last 7 Days
- Last 14 Days
- Last 30 Days
-
Custom timeframe – Specified by the start and end date and time range set in the clock / calendar section
The timeframe property is saved with the investigation filters. However, it can be modified to run a query ad hoc with the same filter statement but a different timeframe.
Configure a Custom Timeframe Range
configure a custom timeframe range.
Step 1 – On the Investigations interface, select the Investigation you want or start a new investigation.
Step 2 – Click the Timeframe displayed in the Filters section.
Step 3 – Set the start date on the left. You can either type it in the box at the top or navigate through the calendar to select the date you want.
Step 4 – Set the start time on the left. You can either type it in the box at the top or click the clock icon within the box to get a menu for selecting the hour, minute, and period (AM or PM).
Step 5 – Set the end date on the right. You can either type it in the box at the top or navigate through the calendar to select the date you want.
Step 6 – Set the end time on the right. You can either type it in the box at the top or click the clock icon within the box to get a menu for selecting the hour, minute, and period (AM or PM).
Step 7 – Click Apply.
The Timeframe window closes and the custom range is visible in the Filters section. Save the changes to the selected investigation, unless you are running an ad hoc query.
Filter Attribute Menu
The Attribute menu in the Filters section has the following options grouped by the type of attribute:

-
Event ( group header in the menu):
- Affected Object – The name of the object in Active Directory that was affected by the event
- Attribute – The specific property or field of the object that was changed or accessed
- Attribute New Value – The new value that the attribute was changed to after the event
- Attribute Old Value – The value that the attribute had before the event occurred
- Blocked – Indicates whether the operation was prevented by a security measure, such as a Netwrix agent
- Client – The device, IP address, or host that initiated the event
- Client Type – The type of client initiating the event, such as host, IP address, or device
- Domain – The Active Directory domain where the event occurred
- Event Operation – The specific action that was attempted or performed during the event (e.g., modify, delete)
- Event Sub-Operation – Additional actions or details related to the primary event operation
- Event Type – The nature or source of the event data, indicating where or how the event originated
- Perpetrator – The user or service account that initiated the event
- Perpetrator Type – The type of account (e.g., user, service) that performed the event
- Success – Indicates whether the action associated with the event was successfully completed
- Tag (Direct) – A label or classification directly applied to the object or event
- Tag (Effective) – A label or classification that applies to an object due to inheritance from a group or policy. For example, if a group has a tag, all its members inherit that tag
- Target – The specific object, resource, or entity that was the focus of the event
- Target Type – The type or classification of the object, resource, or entity that was targeted
- Time of Day – The exact date and time when the event occurred
-
Active Directory (category group header in the menu):
- Affected Object Distinguished Name – The full path and name of the object in Active Directory that was affected by the event
- Certificate Thumbprint – The unique identifier of a certificate used in the event, typically represented as a hexadecimal string
- Encryption Type – The method or algorithm used to encrypt data during the event (e.g., AES, RSA)
- LDAP Query Filter – The LDAP search filter used to query the Active Directory for specific objects or attributes
- Object Class – The type or schema class of the object affected by the event (e.g., user, group)
- Perpetrator Protocol – The network protocol used by the perpetrator to perform the operation (e.g., LDAP, Kerberos)
- Pre-Authentication Type – The type of pre-authentication used before the main authentication (e.g., Kerberos, NTLM)
- Reply Encryption Type – The type of encryption used to secure the response sent back to the requester
-
Entra ID (category group header in the menu)
- Correlation Id – A unique identifier used to link related events across different services, helping to trace and analyze potential security incidents
- Entra Event Id – The specific identifier assigned to an event within Microsoft Entra ID
- Is Interactive – Indicates whether the event involved direct user interaction or if it was a non-interactive event, like an API call
- Location – The geographical location where the event originated, which can help identify unusual sign-ins
- Logged By Service – The specific Microsoft Entra service that recorded the event, providing context on which service was involved in the activity
- Risk Detail – Detailed information about the type of risk detected during the event, such as leaked credentials or suspicious sign-in patterns. This detail helps administrators understand the nature of the threat
- Risk Event Type – The category of risk identified, such as "Anonymous IP Address" or "Unfamiliar Sign-in Properties," which signals potentially compromised activity
- Risk Level Aggregated – The overall risk level assigned after evaluating all related events and signals, such as "Low" or "High"
- Risk Level During Sign-In – The risk level specifically assessed during the sign-in process, indicating how likely the sign-in was compromised
- Risk State – The current status of the detected risk, which can be "At Risk," "Dismissed," or "Remediated," depending on the actions taken
- Target Resource Type – The type of resource or service that was involved in the event, such as a specific application or database
-
File System (grayed-out category group header in the menu):
- Extension – The file extension indicating the file type (e.g., .txt, .docx)
- File Path – The full directory path to where the file is located
- File Size – The size of the file, typically measured in bytes
- File Tag – A label or classification applied to the file for organizational or security purposes
-
Integrations (category group header in the menu):
- Policy – The set of rules or configurations applied within the integration., which may require Netwrix Threat Preventiondatabase access to be configured on the NetwrixIntegrations page. See the Netwrix Integrations Page page for additional information
Filter Operator Menu
The options available for the Operator menu in the Filters section change to match the selected Attribute. The following is a list of all possible operator options:

- Equals
- Not Equal To
- Contains
- Doesn't Contain
- Starts With
- Ends With
Build a Filter Statement
You can create a filter for a new investigation or modify a filter for a saved investigation. Follow the steps to build a filter statement.
Step 1 – Navigate to the investigation you want's Filters section.

Step 2 – If multiple data sources are configure, select a source from the Source dropdown menu.
Step 3 – Set the timeframe for the event data to be returned in the report.
Step 4 – Select an attribute from the Attribute dropdown menu.
Step 5 – Select an operator from the Operator dropdown menu.
Step 6 – Enter a value in the Filter box. Possible values available from the events appear in a dropdown menu as you type. Select the value you want from the dropdown menu. If the value you type isn't available in the dropdown menu, use the Add button to add it to the Filter box.
Adding additional values in the same Filter box will add an OR statement for the attribute. For example:
-
When:
- Attribute = Perpetrator; Operator = Equals; Filter = nwxtech\ad.bruce.wayne, nwxtech\ad.robin.locksley
-
Then the query returns activity for nwxtech\ad.bruce.wayne OR nwxtech\ad.robin.locksley
Step 7 – To form a complex filter with multiple attributes, click Add to insert a new row and repeat steps 4-6. The AND operator is automatically applied to group multiple rows. For example:
-
When:
- Attribute = Perpetrator; Operator = Equals; Filter = nwxtech\domain admins
-
AND
- Attribute = Perpetrator; Operator = Not Equal to; Filter = nwxtech\ad.bruce.wayne
-
Then the query returns activity for all domain admins except nwxtech\ad.bruce.wayne
Click the X at the end of a row to remove it from the statement.
After the filter is set, you can generate the report ad hoc by clicking Run Query. The allows you to test if your filter statement is working as desired. Save the investigation for reuse. You can also add subscriptions or export the report data using the options above the Filters section.
See the Investigation Reports topic for additional information.