Home Page
The Home page provides a summary overview of the possible threats detected in an organization's environment for the past 24 hours.
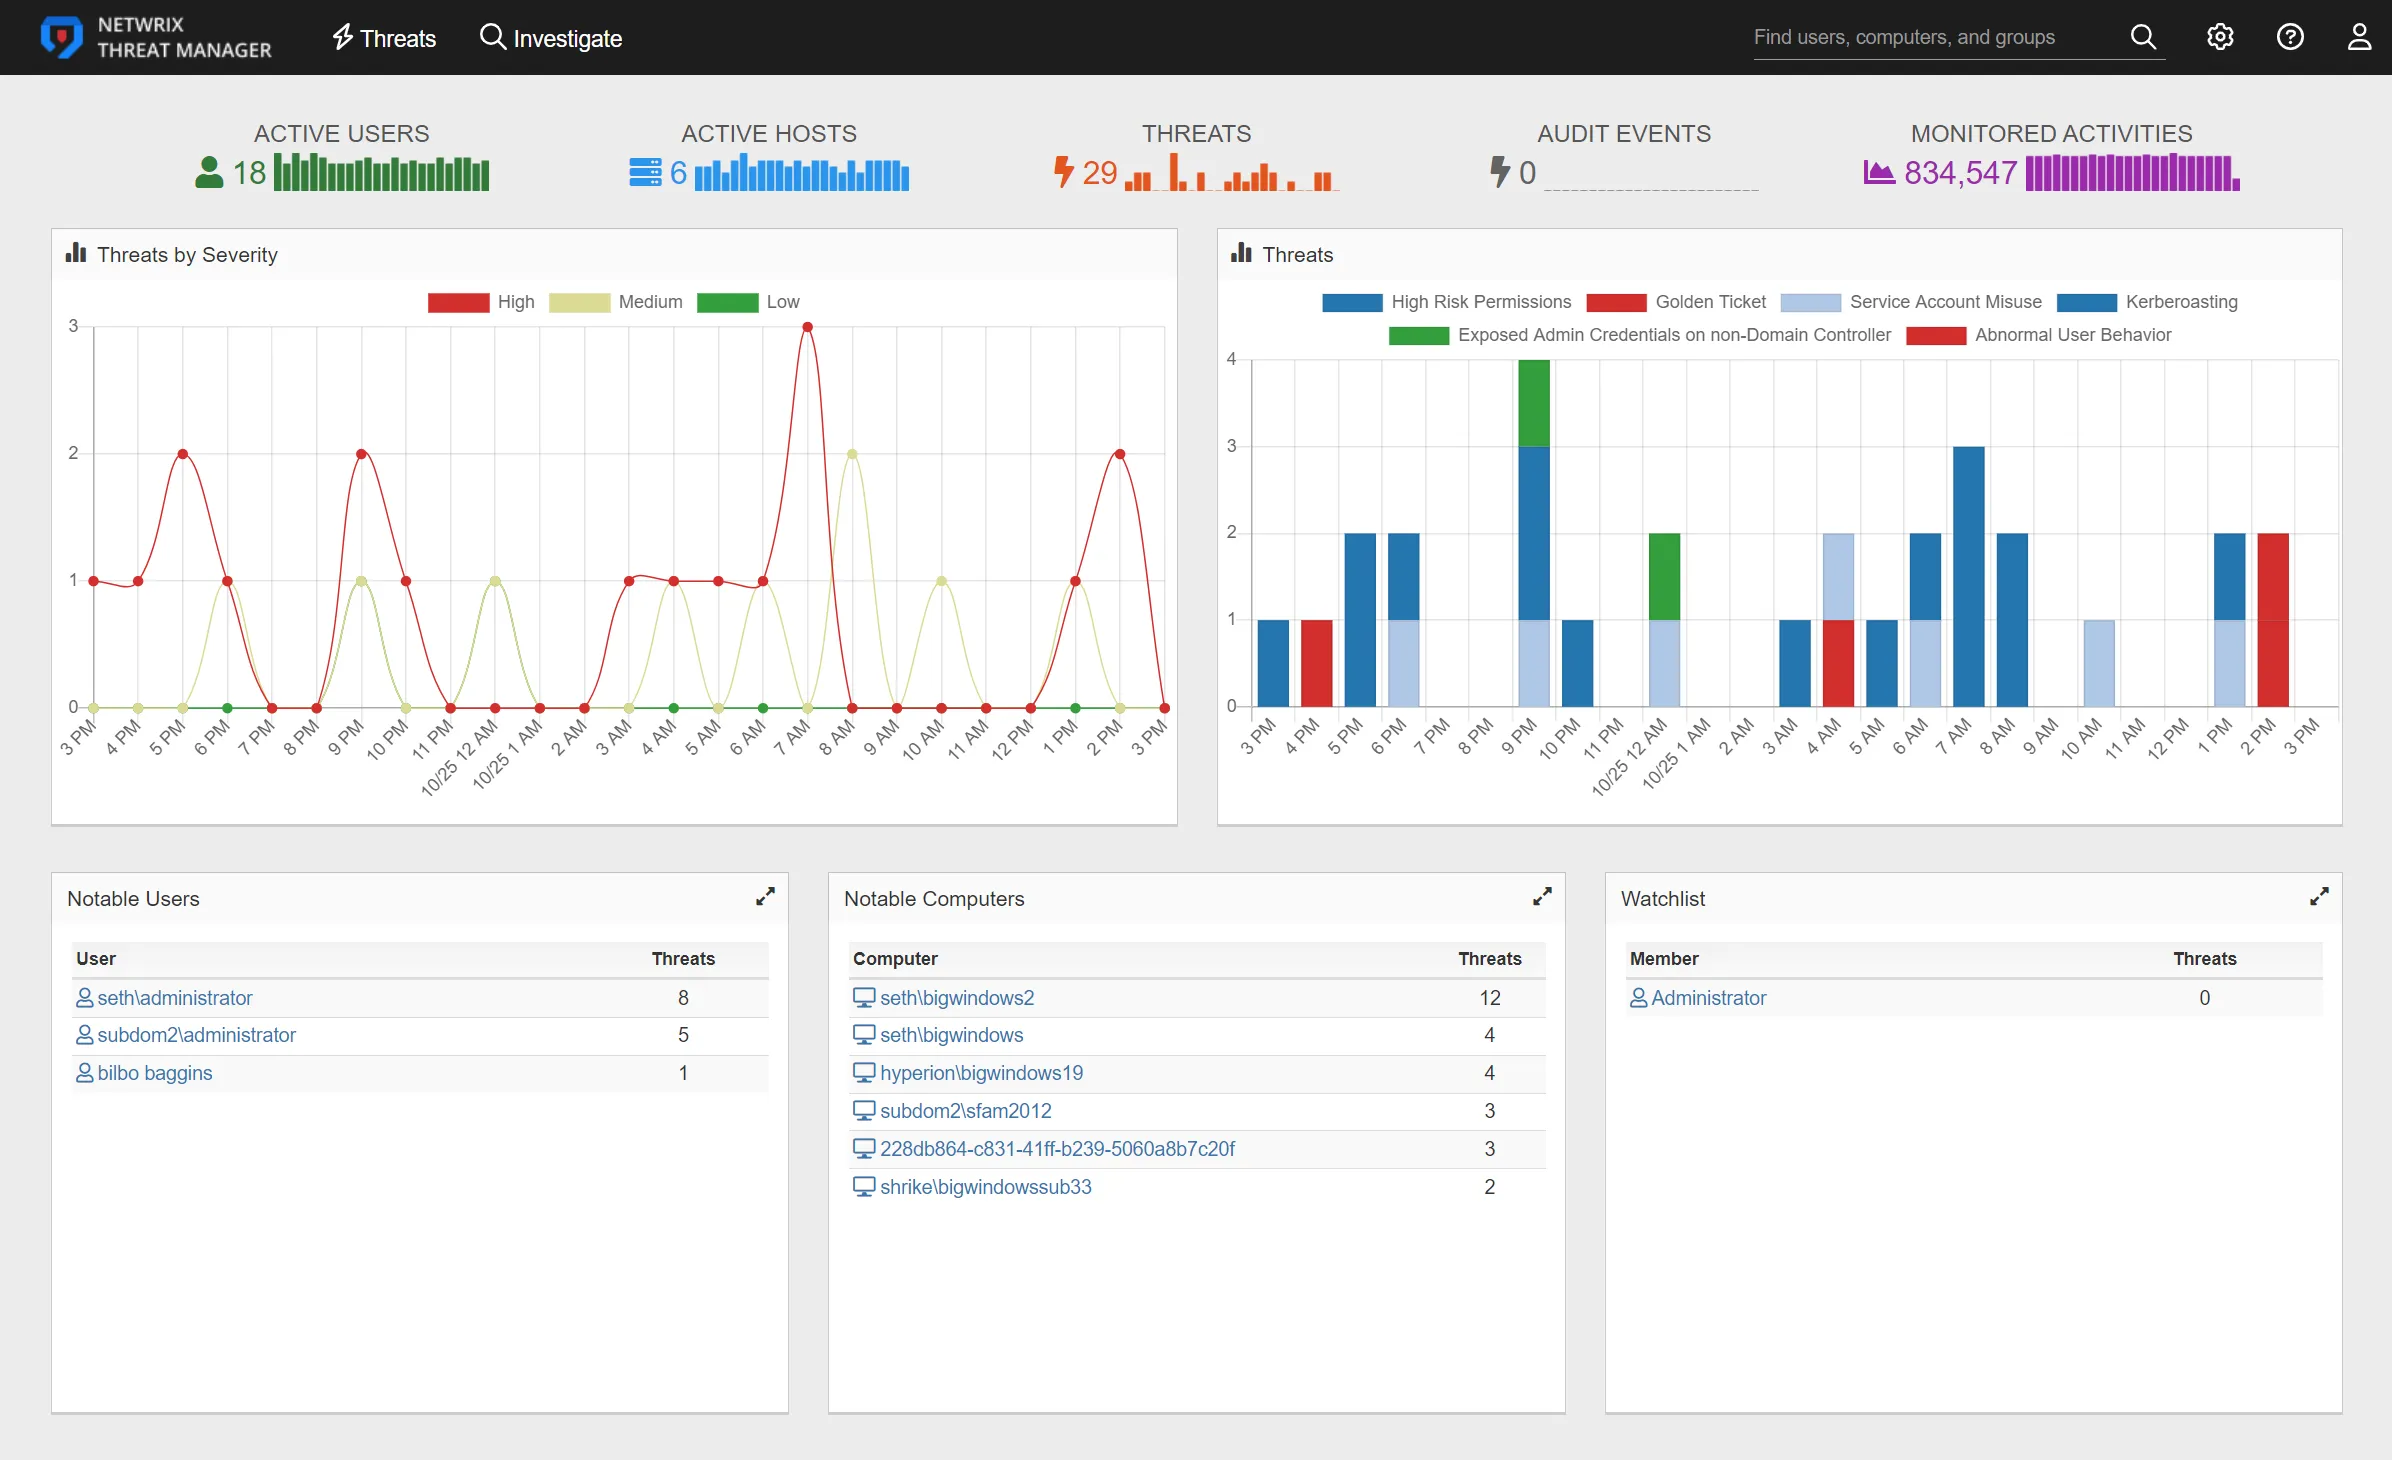
The daily activity summary bar graphs at the top of the page contains the following items:
- Active Users – Number of unique active users. The bar graph displays the number of active users in 1-hour increments.
- Active Hosts – Number of active hosts. The bar graph displays the number of active users in 1-hour increments.
- Threats – Number of threats detected in the past 24 hours. The bar graph displays the threats detected over the past 24 in 1-hour increments.
- Audit Events – Number of instances of activity that aren't necessarily threats, but should be monitored
- Monitored Activities – Number of monitored activities. The bar graph displays the number of monitored activities in 1-hour increments.
Hover over the trend lines in the bar graphs to view the number of threats that occurred during each time interval and identify any spikes in activity.
Home Page Charts
The Threats by Severity chart displays all threats by threat level to give a visual representation of threat severity for the past 24 hours.
The Threats chart displays each threat type detected in the past 24 hours. Each bar on the Threats chart filters the threats by an hour-long time frame. The bars are hyperlinks that can be clicked to display the Threats page. The Threats page shows the threats detected for the selected time frame.
Home Page Tables
The Home page displays the following tables:
- Notable Users – The Notable Users table displays users that are perpetrators of a threat. Click the user to go the User Details page for that user.
- Notable Computers – The Notable Computers table displays computers where threatening activity has occurred. Click the computer to go to the Computer Details page.
- Watchlist – The Watchlist table displays users with the Watchlist tag and a count of any associated threats